
Find some examples of information graphics. For example bus timetables, city maps, diagrams or representations of statistical data. Look at the way they are designed and try and work out the decisions the designer made. What can you learn from them and when would it be appropriate to use a similar design solution?
OCA Graphic Design Core Concepts
For this exercise you are going to describe your immediate surroundings using information graphics; this could be a plan of your desk, the layout of your house, the arrangement of objects in your cupboards or your morning journey; anything will do.
Before you start you will need to think about scale and about how you will break down the information for your design. Create a graphic that represents an aerial or front on view of your location. Be mindful of the hierarchy of the elements in the composition and the dynamics needed to draw the viewer’s eye from one stage to the next. Use typography, numbers and colours to describe what is being represented. You may want to produce a key to help us understand what is being shown, as well as a diagram title to put things in context.
Keep all your sketches and notes in your learning log.
In this exercise I was asked to look at infographics and what makes a good infographics design and then create my own on something around me.
What are infographics?
Infographics (a clipped compound of “information” and “graphics”) are graphic visual representations of information, data or knowledge intended to present information quickly and clearly. They can improve cognition by utilizing graphics to enhance the human visual system’s ability to see patterns and trends.[3][4] Similar pursuits are information visualization, data visualization, statistical graphics, information design, or information architecture. Infographics have evolved in recent years to be for mass communication, and thus are designed with fewer assumptions about the readers’ knowledge base than other types of visualizations. Isotypes are an early example of infographics conveying information quickly and easily to the masses.
Wikipedia
This basically means that these deigns relay otherwise hard to understand information in a graphical way to make them more easily understandable.

I think this is very effective, because it uses language we all understand. By using lego blocks it makes this information very accessible to anyone. In the first picture we have just data, which is represented by the mass of lego blocks in a pile. This doesn’t give us much information beyond what colour lego blocks there are and perhaps the volume of thee whole lot.
In the next image the blocks are separated by colour. This just allows us to more easily distinguish how many colours there are and perhaps give us a rough idea of the amount of each of the colours. In the next one they are stacked on top of each other, but not in a very orderly fashion, so this makes them quite hard to read in terms of amounts of each colour. in the fourth image they are stacked in a way that helps you understand the amount of each of the colour very easily, and you can almost count the blocks.
This infographic shows very clearly that there are many different steps, and things to consider when creating an infographic.
The next one I looked at was a much more complex infographic about the history of art.
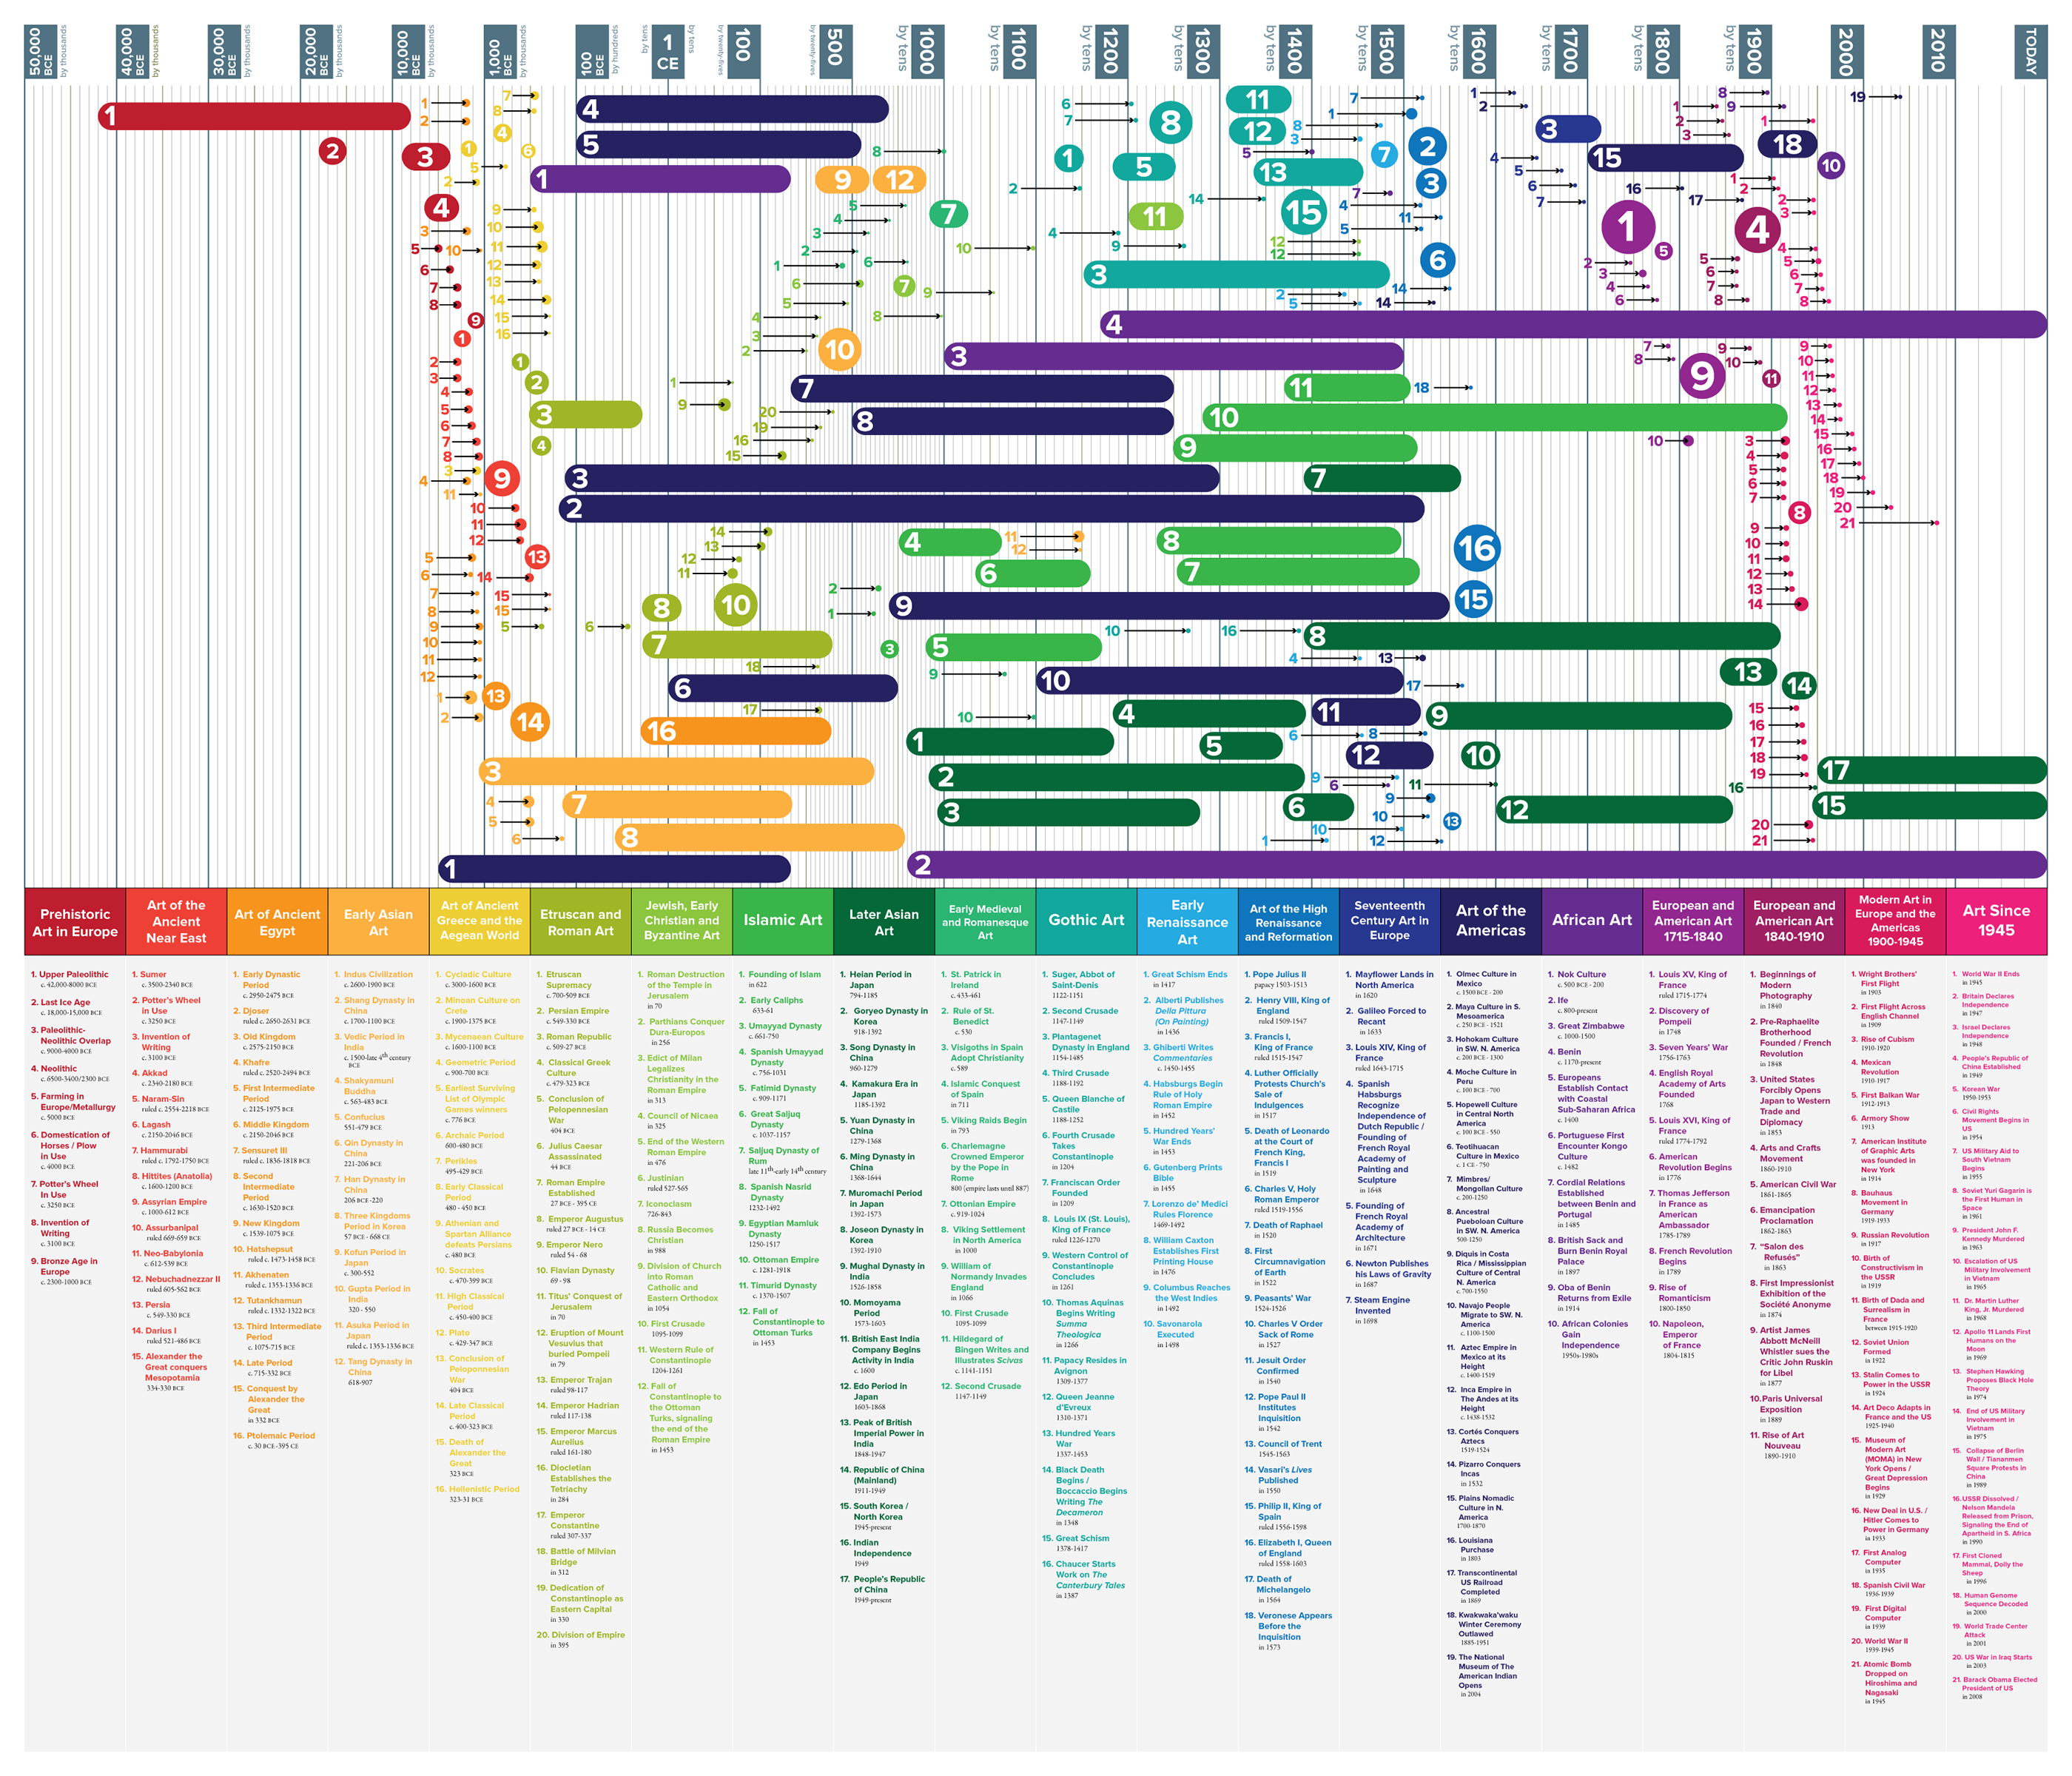
This infographic looks quite complex, but it effectively communicates a vast amount of data quite simply. I think what makes this most effective is the colour. It is very easy to identify which period we are talking about for each of the categories because it’s relayed in a vey simple linear fashion that is easy to read.

Next I wanted to look at the map for the London Tube network. I always admired how clean and easy to understand it is. The tube is pretty hard to navigate without this and even after living in London for almost 10 years I often end up using it.
I think the effectiveness fo this lies in its simplicity, and the fact that all the information is present where you need it without over-cluttering the page. Multiple keys are also included with this map to aid the reader in understanding everything they see. I also like the fact that the designer kept all text horizontal. This also aids the reader in easily finding what they are looking for and keeps it all consistent. I think this decision alone probably could make or break this design. The colour are also representative of each of the tube lines that makes this map a lot more clear. I think this is a really effective design.
I decided to create a journey planner or commute time checker for my journey to work. I wanted to highlight the below information:
- Time of journey
- Number of transfers/connections
- Total time
To do this I first thought I will create a tube map like diagram where there stops are connected by lines in a map like manner.
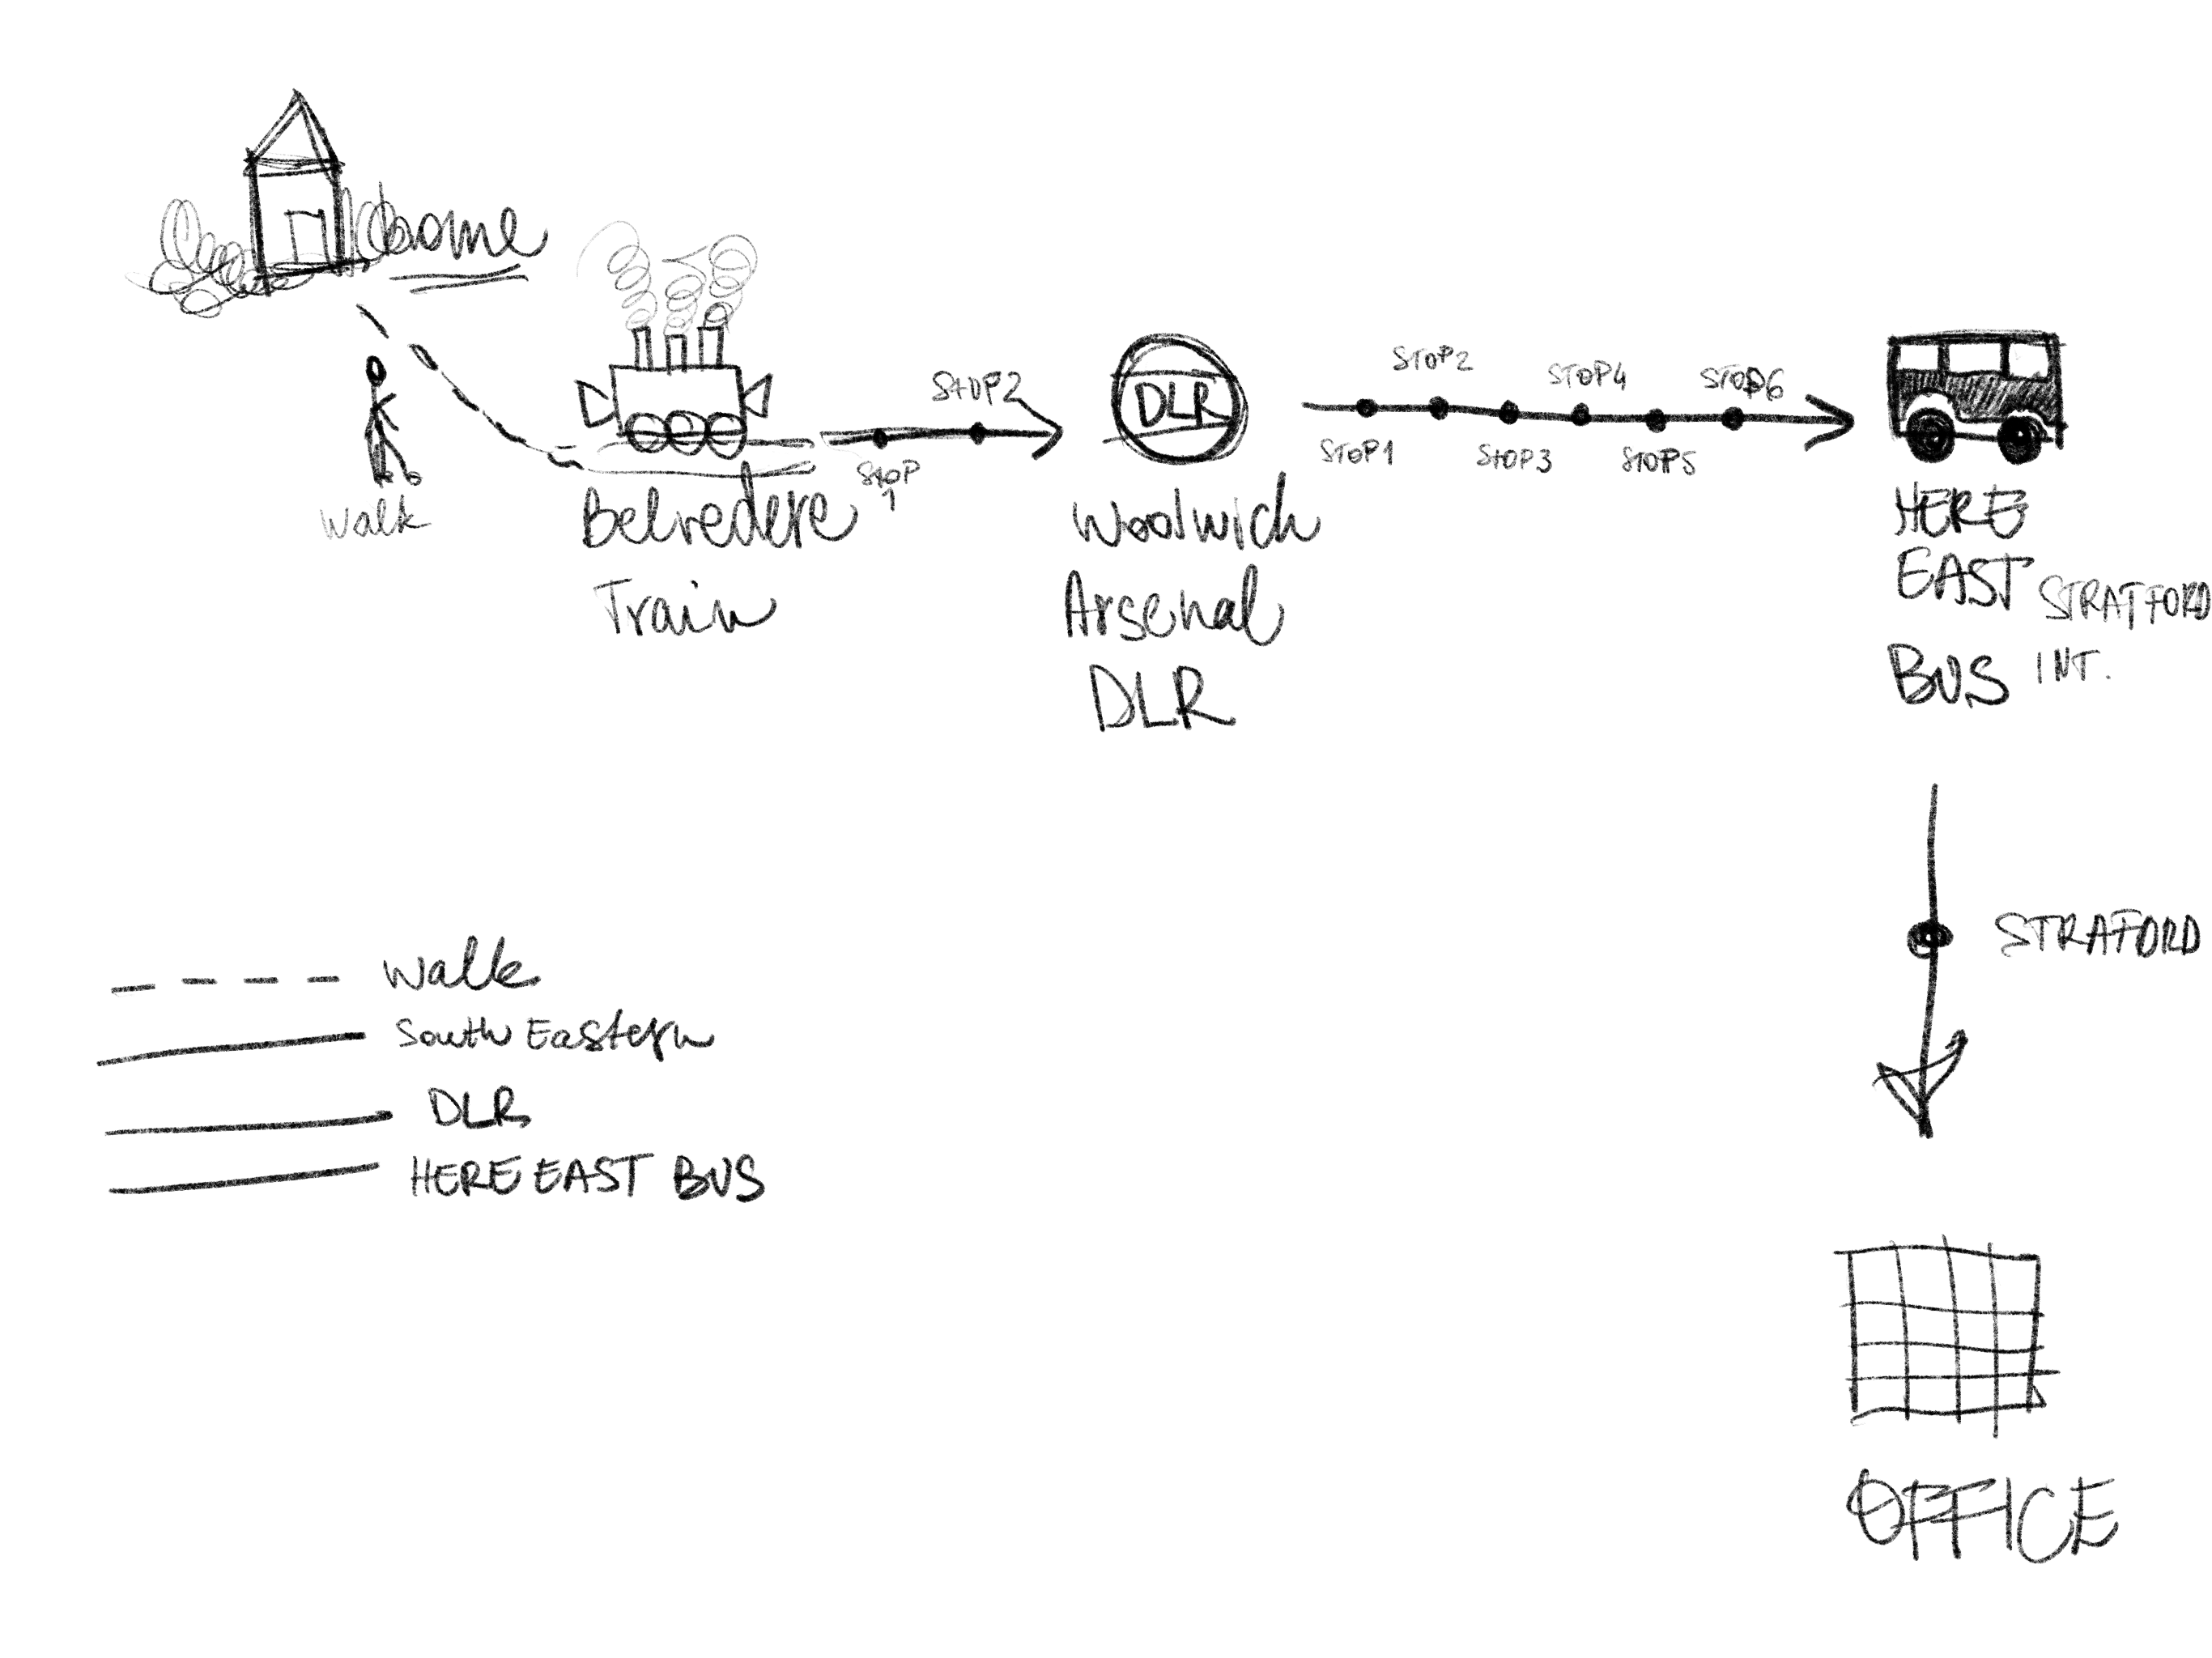
In my head I had an idea of creating something illustrative perhaps for the stops and connecting them showing the different stations etc.
Once I started working on this, I realised that none of the above mattered and the information should be relayed in a more clear manner so that the viewer doesn’t get distracted by the illustrations but look at the information that is given instead, to make an informed decision about what commute option to choose. I think this is a classic example where less is more.
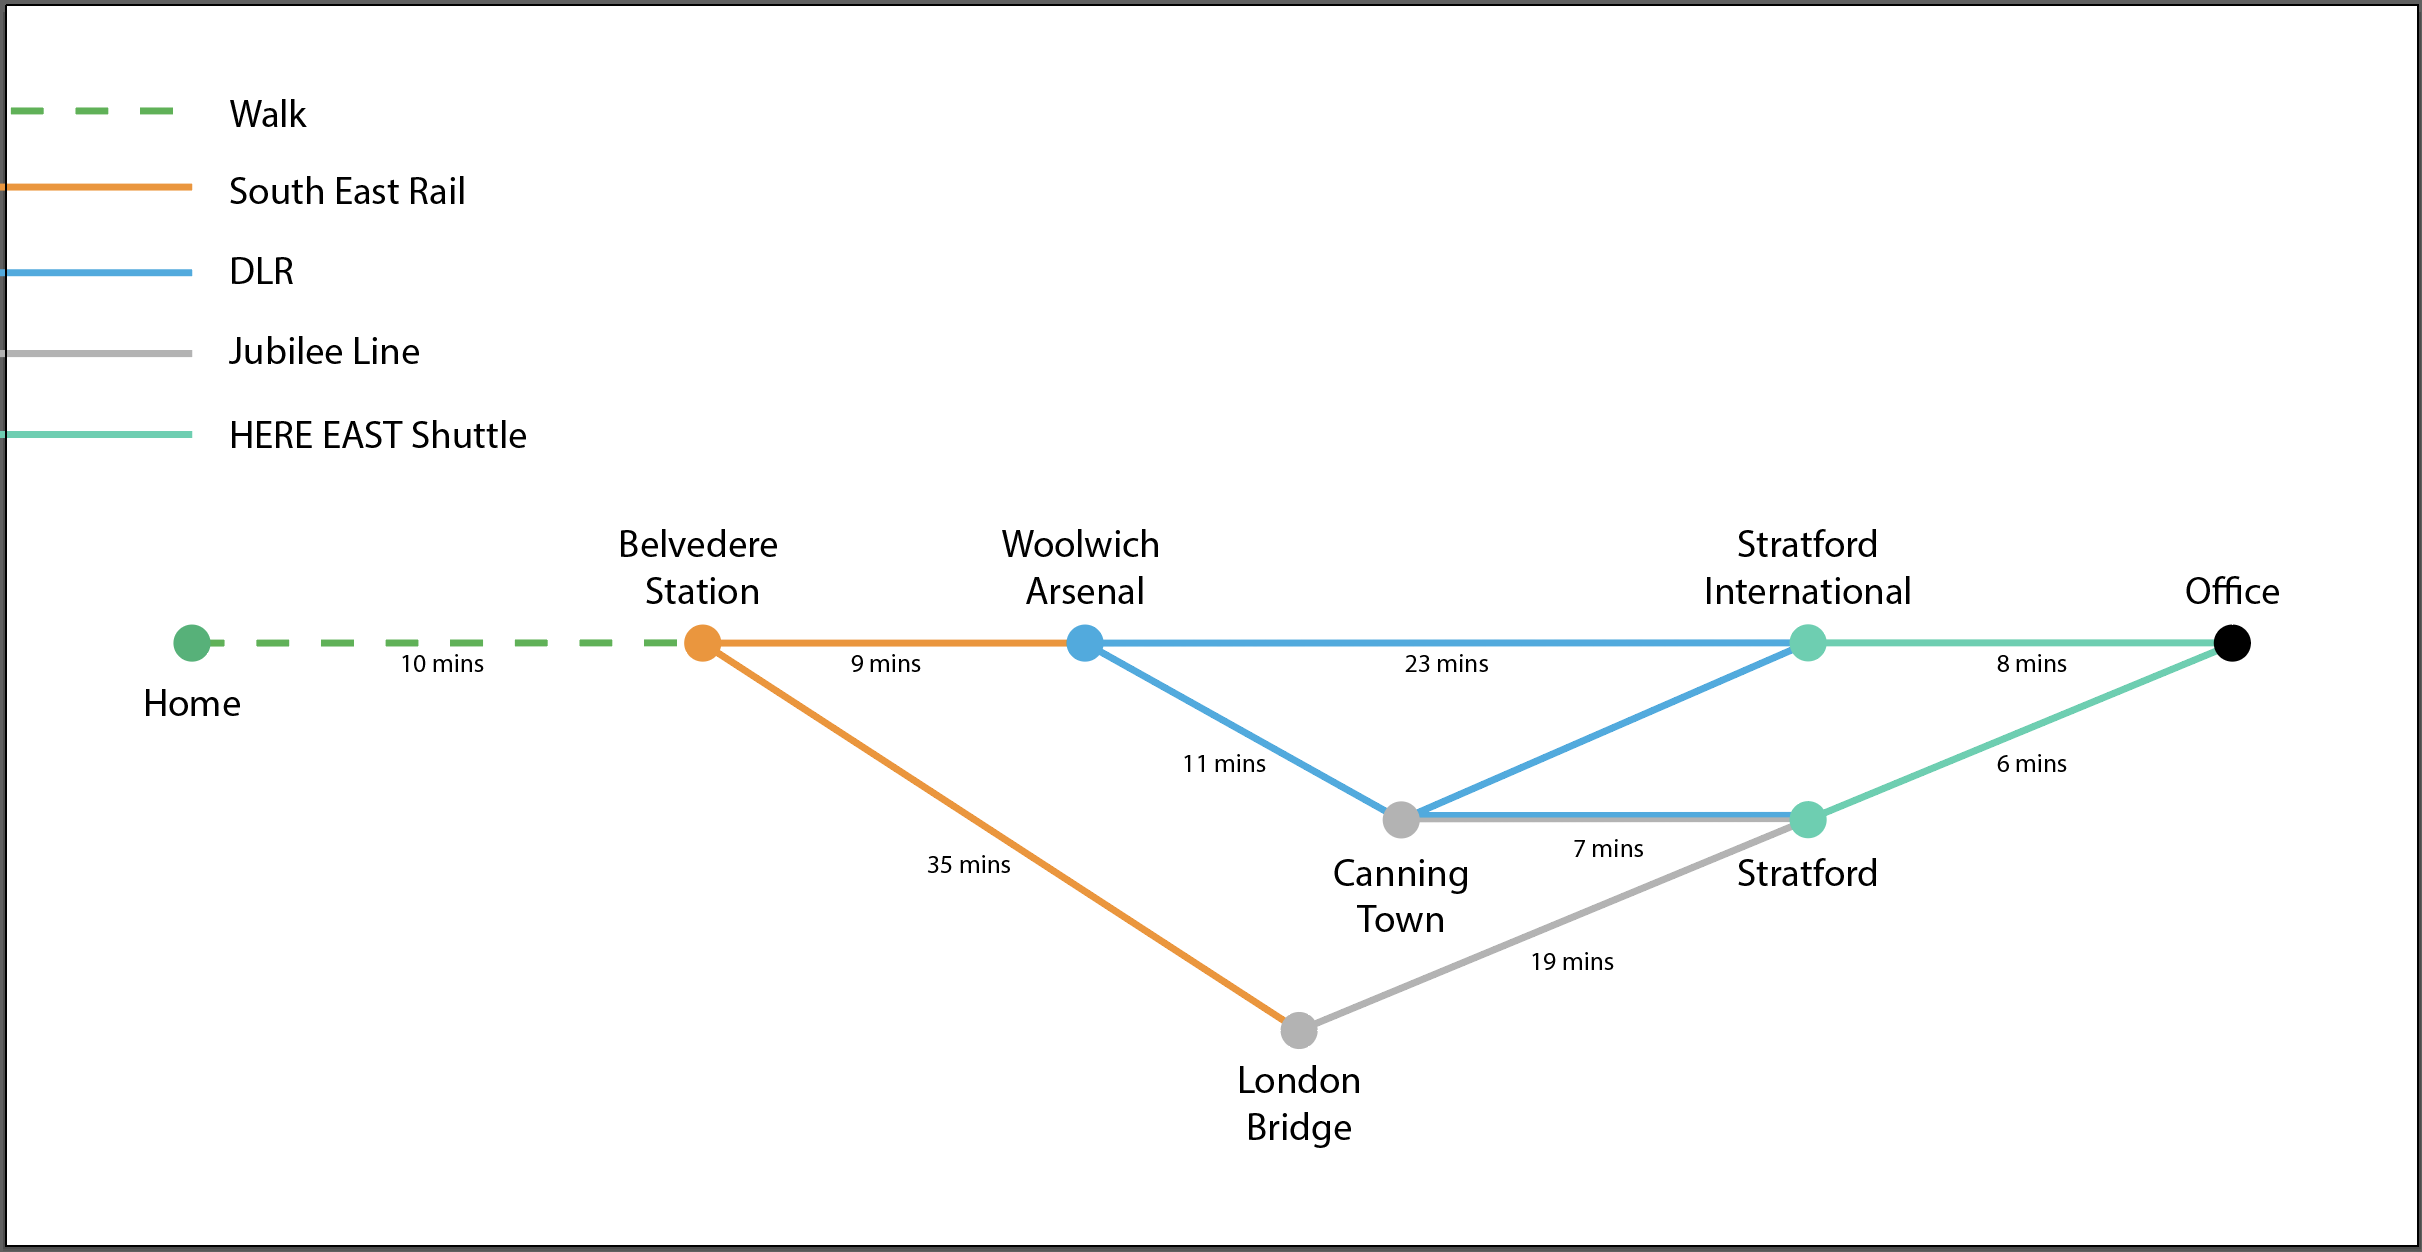
I liked this very much as it has looked a lot like the tube maps I had in mind, and I believe it has given the information quite clearly, however, it turns out I was wrong. When I shown this to some people they immediately questioned wether the top option is the most effective. This is not the case as one of the other journey options is actually shorter.
I decided to do a different approach to lay out this information instead, I thought that a bar chart type of graphic will show this more adequately.
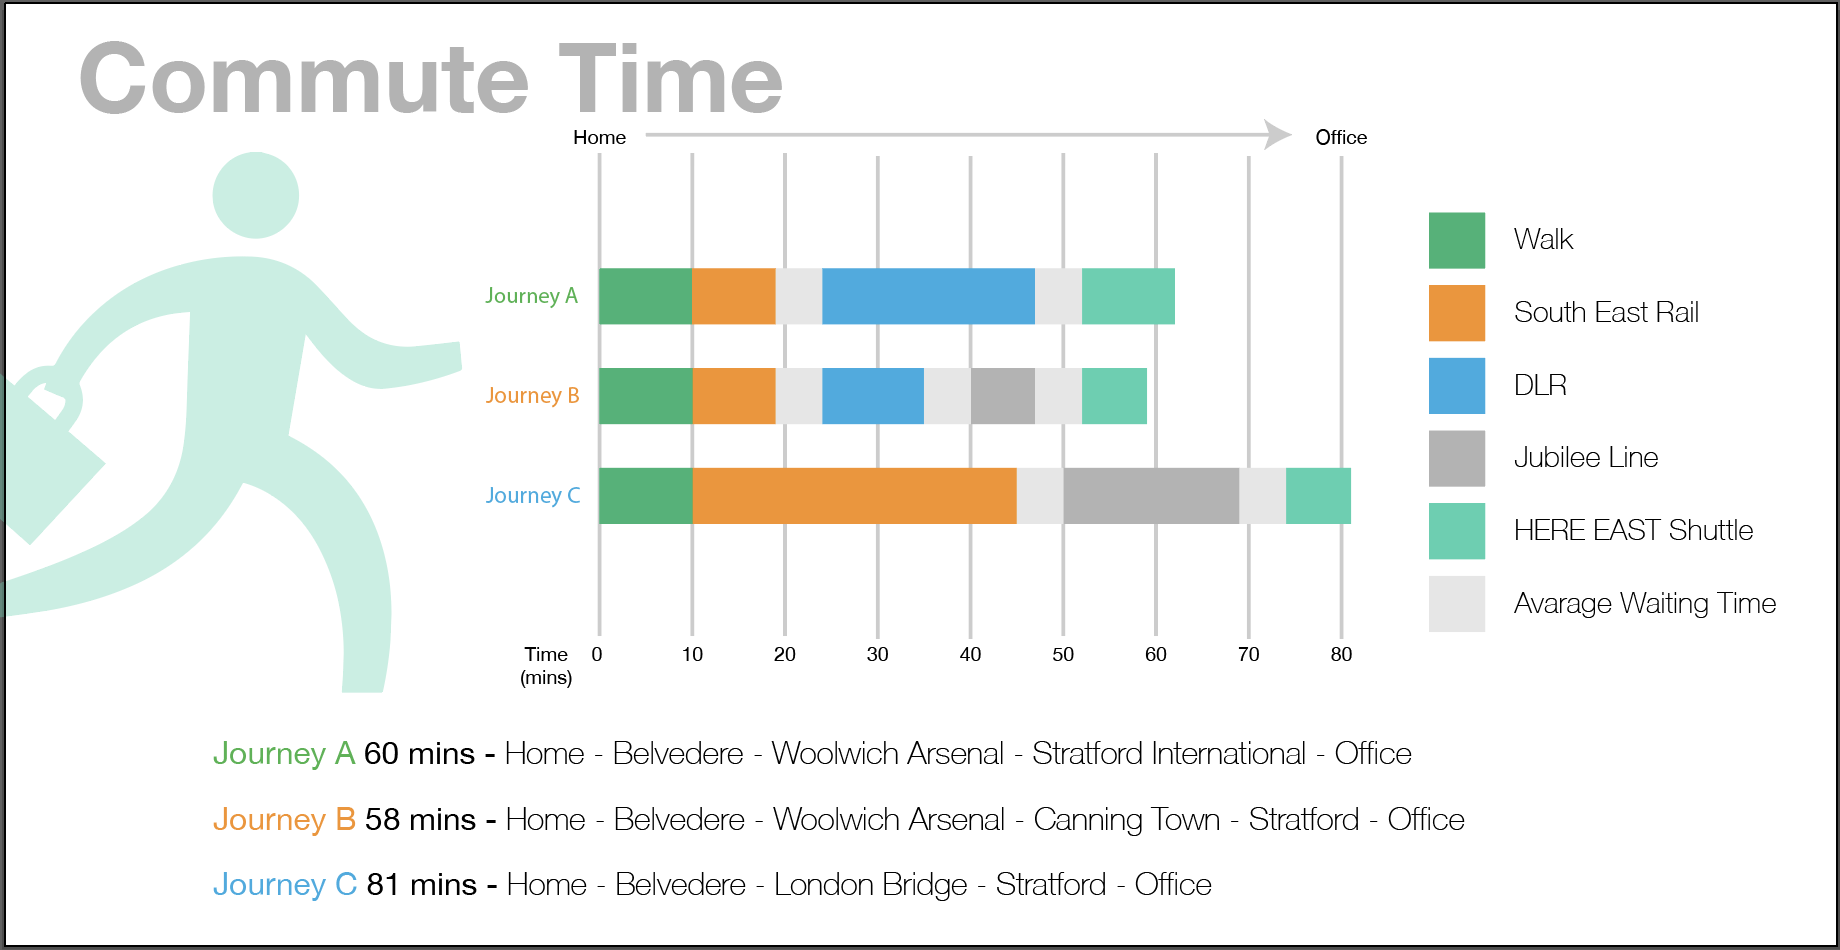
I felt that this shown the travel times really well, however if I didn’t look at the icon I used in the graphic and removed all the text, it would be really difficult to understand what this chart tries to communicate. I decided to try to create something based on the tube map again, but show more information by looking at the number of stops between connections and highlighting the time spent travelling between the main stops where I would be able to change.
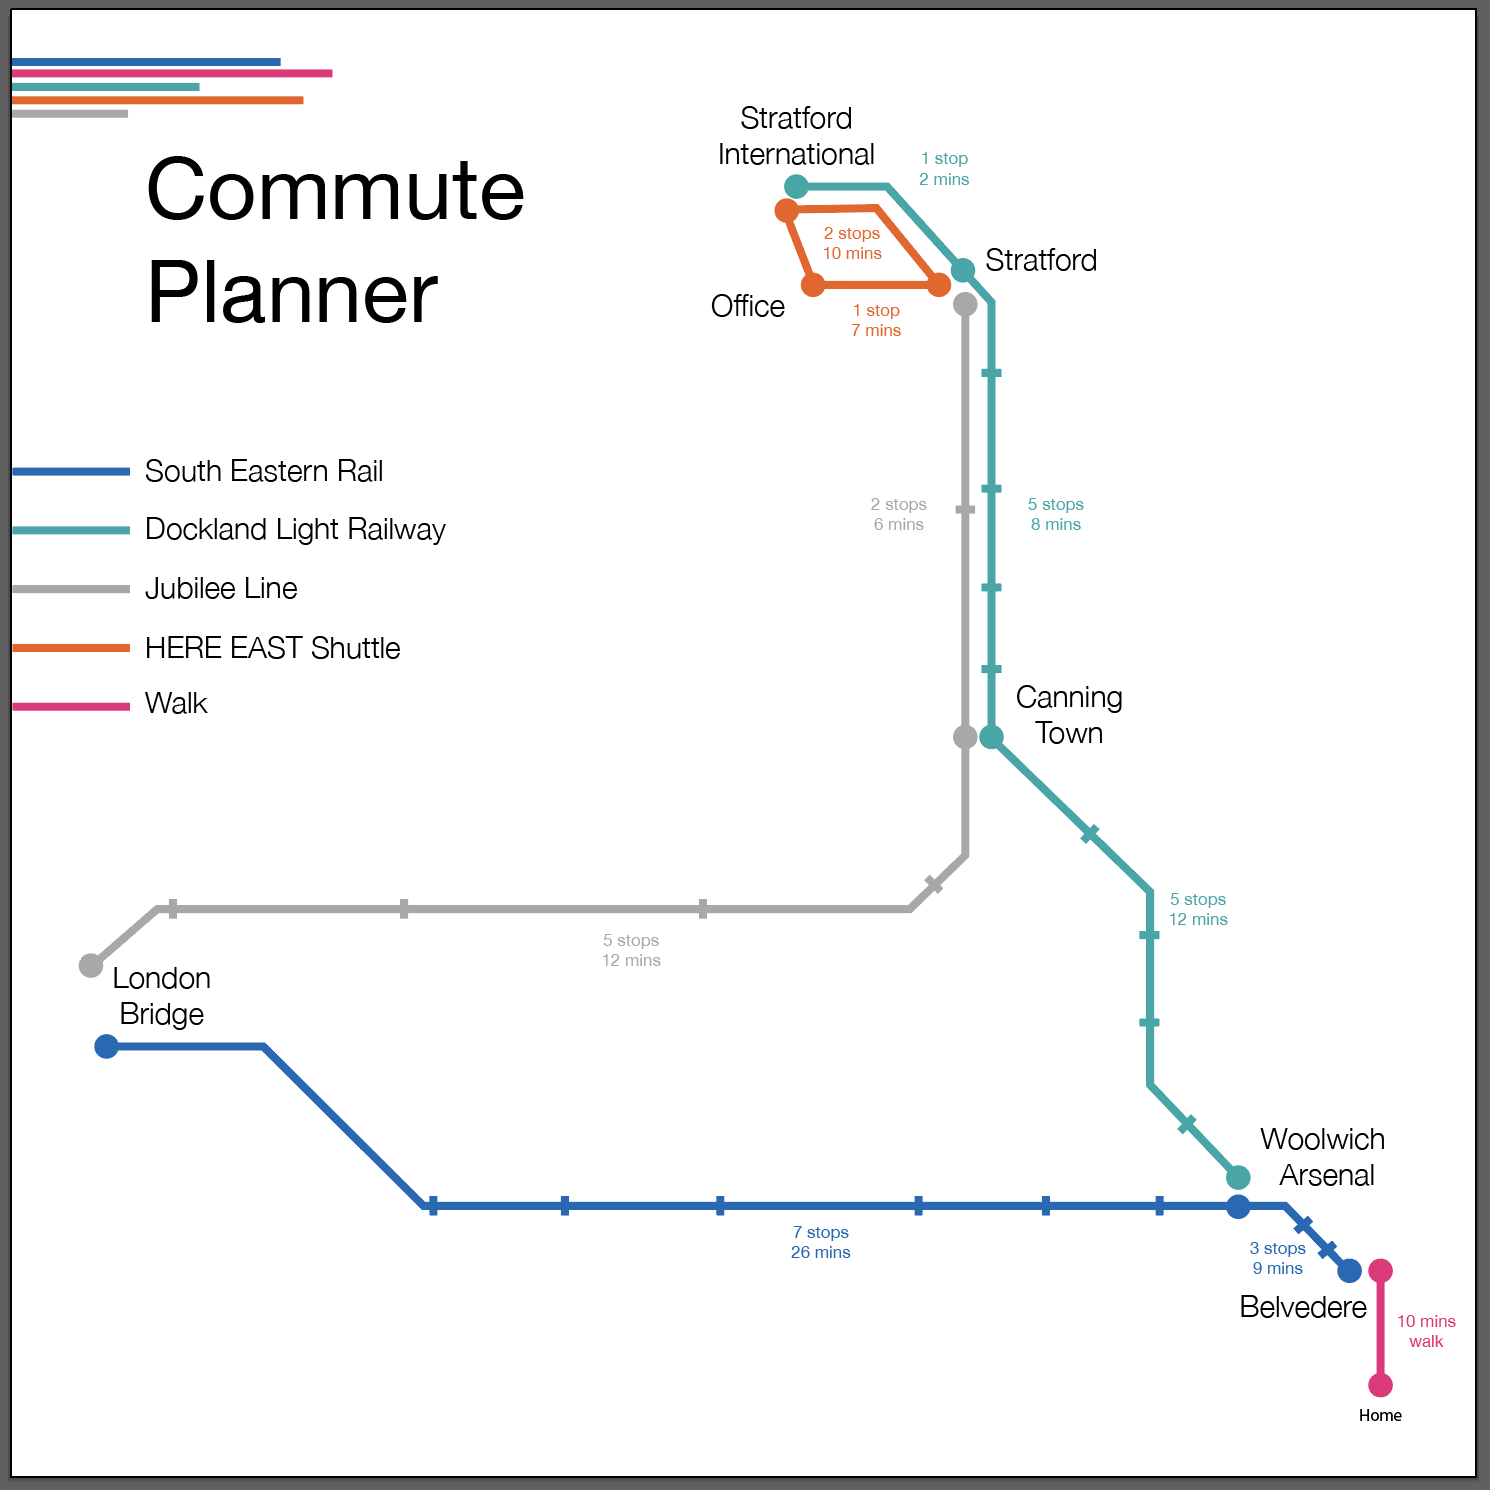
I think this last one was the most successful of the 3. Admittedly, this is heavily inspired of the tube map, I even used the curves that describe these parts of the lines, so this is not very original, but this shows all of the different connection points and shows the times which makes easier to find a suitable path. I believe this is quite successful.
Reflection
This part really shown me that infographics are not easy to do. They may look effortless, however they need careful consideration and planning in advance to create something that is truly representative of the data that lies behind the graphics. Colours, shapes and typography are a very important tool in creating infographics as well. I think I will have a deeper appreciation for infographics going forward. I have ordered a book called “Information is Beautiful” by David McCandless to learn more about the topic.
